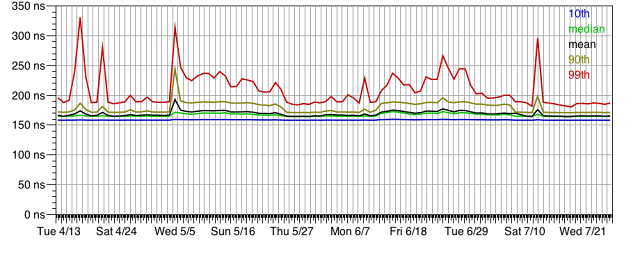
Most of the graphs look pretty uneventful. This computational benchmark from EC2 (measuring Math.sin) is typical:
Basically unchanged. (The early blip in median latency might be a statistical artifact: the histogram shows a large peak around 130ns, and a smaller peak at 250ns; perhaps the large peak comprises more or less precisely half of the samples, so as it wanders from 49% to 51%, the median could flit back and forth between the two peaks..)
The Math.sin benchmark running on App Engine shows a little more variation:
Shared storage services show much more variation. Here is the latency to read a single record from an Amazon SimpleDB database (without consistency):
Here's the same graph, with the vertical scale capped at 100ns to make the lower percentiles more visible:
The lower percentiles look steadier, as one might expect -- intermittent issues are likely to be fringe issues, and thus to disproportionately affect the higher percentiles.
App Engine Datastore read and write latencies wander around in a similar manner -- here's the graph for (non-transactional) reads:
EBS read and write latencies are comparatively stable, with some variation at the 99th percentile. EC2 local-disk latencies are even more stable. Amazon RDS latency is another story -- look at this graph for reads (of a single record from a pool of 1M records):
There have been a couple of distinct improvements in 99th percentile latency. Expanding the Y axis shows more detail for the 90th percentile:
It has wandered around, though it improved sharply a few weeks ago along with the 99th percentile, and has been quite steady since then. Further expansion (not shown here) reveals the median and 10th percentile latencies to have been rock-solid all along.
Here is the graph to write one record to RDS:
Again we see a sharp improvement around July 9th. Zooming in shows that the 10th percentile and median values have actually gotten worse over time:
While RDS read latencies have improved substantially, the bizarre 6-hour cycle is still present. This graph, showing a couple of days on either side of the July 9th improvement, makes that clear:
(Note, in this graph the Y axis has been clipped at 300ms; many of the peaks are actually as high as 750ms.)
Of course, I have no way of knowing what caused any of these variations. I haven't gone near these servers in quite some time, so the RDS latency improvements in June and July can't be anything I did. Just another reminder that you can't take the performance of a shared service for granted. I did receive a communication in late June from AWS support that "we are currently working on adjustments that would reduce latency in the db.m1.small instances"; this may explain the drop on July 9th.
I'll revisit this topic every few months. Until then, back to the logging project...


No comments:
Post a Comment