App Engine Memcache
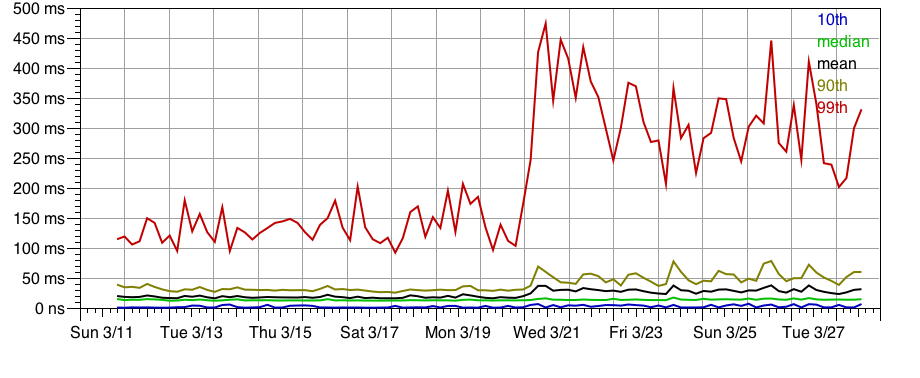
I'm running a number of benchmarks for App Engine's Memcache service, but they all give similar results, so I'll focus on the simplest: reading a single value, with a random key. Here's a graph (from http://amistrongeryet.com/op_detail.jsp?op=gae_db_read_1):

Aside from the jump on April 23d, these latencies are pretty stable, probably the most stable of any network-based service I'm measuring. There's not much variation over time, and the gap between the 10th and 99th percentile is fairly small. In absolute terms, it's the fastest of the storage services I discussed last week, and much faster than the other network-based services.
So what's the anomaly? Well, this service is fast, but not as fast as it should be. Remember, the "mem" in Memcache refers to RAM. A Memcache read amounts to a hashtable lookup. Server-side execution time should be trivial, and client-perceived latency (as I'm measuring) should be dominated by network latency. 13 ms median is a long time for an intra-cluster round trip. Equally suspicious, across 125,000 samples to date, the minimum time recorded was 5 ms. It's hard to explain that with network latency unless the App Engine servers are hundreds of miles away from the memcache servers -- which makes no sense. (By way of comparison, I've been measuring ping times within and between Amazon EC2 availability zones, and the median latencies are 450 microseconds and 2 ms, respectively. I don't have a way of directly measuring App Engine's internal network, but there's no reason to believe it would be vastly slower.)
In the end, someone at Google was kind enough to explain this for me. It turns out to be a known issue with the RPC implementation in the Java version of App Engine, with the effect of imposing a floor on RPC latency. Operations which take longer than this floor -- say, Datastore access -- are not affected, but fast operations like Memcache are. It will be fixed in a future App Engine update.
As a cross-check, it was suggested that I re-implement the benchmark in Python. The results are indeed much faster, with median latency of 4.15 ms (compared to 22ms from Java, after last week's jump).
One lesson here is that it's important to have an intuition of what's reasonable. Memcache was one of the fastest services I measured, but it was still slower than it should have been. If you don't have a sense of how your system ought to behave, you'll miss problems.
Another lesson is that no story ever ends; there are always loose ends you don't have time to tie up. In this case, there's that mysterious jump on April 23d. There's also a fairly long tail even in the Python latencies, which could have any number of causes, from network congestion to garbage collection to CPU contention. I'm not going to bother looking into any of that, but if I was building a system that depended on ultrafast memcache latencies, I'd probably have to.
EC2 networking
On April 24th, I added a handful of network benchmarks. Each benchmark measures ping times, from the data gathering server (an EC2 "small" instance in availability zone us-east-1b) to a particular destination:
I'm only measuring one instance of each category (e.g. one pair of servers in us-east-1b), so take the results with a grain of salt. But, hopefully, sampling over a long period of time compensates somewhat. Eventually I may get fancier, launching a collection of servers for an hour now and then and measuring ping times across many server pairs.
Network latencies are important. Any complex system depends on communication among its components. If you want to run a reliably fast service, it helps a lot to have reliably fast networking. At a minimum, you need a deep understanding of your network latency; otherwise, you can't hope to understand how your service will behave.
After running the benchmark for a few hours, the latency histogram for intra-zone pings looked like this:

I was dismayed to see that 99th percentile latency was 48 ms. That would make it very difficult to meet the 50 ms goal I set for storage read latencies in my previous post -- just getting to the storage server would use up the entire latency budget. As with memcache, this result struck me as fishy, so I decided to dig further. It struck me that Amazon might use a short DNS TTL for the internal server names in their data centers, and that DNS latency might be part of the problem. So I added two variants of the intra-AWS ping benchmarks. One variant uses a numeric IP address instead of a DNS name, and the other variant issues two pings in a row and measures latency of the second. (All of this is done using the "ping" command-line tool. I'm exec'ing it from my Java process, and parsing the ping time from the command-line output.)
Both variants were, indeed, much faster. (More precisely, they had shorter tails. All variants are fast at median.) But the really interesting thing is that, when I launched the new variants, the original benchmark sped up as well! Here's a graph over time of the original intra-zone ping benchmark:

Considering only the time period in which all three benchmarks were running, they still have distinct latency histograms:
Original benchmark (single ping, using DNS name):

Same benchmark, but using a numeric IP address instead of dns name:

Back to using a DNS name, but now telling the ping command to issue two pings, and recording the latency of the second one:

Median latency for each variant is around 0.45 milliseconds. The means are 3, 2.45, and 2.13 respectively. Eyeballing the histograms, you can see that the pronounced spikes at 10 and 20 ms are smaller in each subsequent benchmark. The large peak around 0.45 milliseconds seems to be shifted somewhat to the left in the third benchmark; I wonder if that is sampling bias: during momentary network congestion, the first ping might not complete until the congestion clears, giving the second ping a better chance at a smooth run.
These figures also gave me a nice example of the danger of reading too much into percentiles. 90th percentile latency for these three benchmarks is 12 ms, 9 ms, and 0.77 ms respectively. Huh? Obviously the third benchmark is not ten times faster than the others. This is an artifact of the trimodal distribution. In the first two benchmarks, a bit more than 10% of requests fall in the 10ms and 20ms spikes. In the third benchmark, a bit less than 10% of those requests fall in the spikes, so the 90th percentile latency jumps down into the primary peak.
I'll explore network latency further in subsequent posts, where I'll try to identify (or, if necessary, invent) a reliably-fast Java RPC mechanism. For now, a few things are worth noting:
- Median intra-cluster network latency is very fast, relative to the systems I've been benchmarking.
- Network latency histograms are complicated. (This should not surprise anyone.) You can't characterize network performance with a single number like "mean ping time" or "rate of packet loss".
- If you care about the latency tail, you have to worry about things like DNS lookup, even within your data center.
- (Hypothesis) it helps to keep your connections hot, i.e. to exchange messages frequently. "Warm" -- say, communicating every 10 seconds -- isn't good enough. This has implications for large clusters: if a server communicates with many other servers, it's hard to keep all of those pairs hot. (Unclear whether this is an issue if you avoid DNS and use numeric IPs.)

Second, us-east-1b to google.com (DNS):

Median latencies are 2.05 and 4.56 ms, respectively. Means are 5.62 and 11; 99th percentiles are 30.9 and 51.6.
I'm not sure what I should have expected, but these seem nicely fast to me. Google must have presence quite close to Amazon's us-east-1b facility. (The Yahoo ping times were much slower, but given that I'm only measuring from a single location, it would be a mistake to read much into that.)
RDS
RDS, recall, is Amazon's hosted MySQL service. The benchmark I'll discuss here is the read benchmark I used in the last post, i.e. fetching one small record chosen randomly from a table of one million records. Full data for this benchmark is at http://amistrongeryet.com/op_detail.jsp?op=rds_read.
When I first launched this benchmark, the latency histogram looked great:

When I checked later, median latency had stayed put, but the tail had stretched way out. Here's the cumulative histogram over the entire week-long history of this benchmark:


The short answer is, I do not yet know what is up with that oscillation. I've been digging; started a thread on the AWS forum; and opened a case with AWS support; but no resolution yet. Some things I've tentatively ruled out:
- Client issues (e.g. CPU contention, Java GC delays, or other problems in the client). The same client is running a wide variety of other benchmarks, and none of them show anything similar.
- Network issues. A fair number of those other benchmarks depend on the same us-east-1b network. (It is conceivable that it is an issue specific to the network path between my client and the RDS instance.)
- Disk latency. I've implemented a few variants on the benchmark, one of which reads the same record over and over again; that record ought to get pinned in MySQL's cache. The single-record benchmark exhibits the same periodic latency tail.
A fourth anomaly: EBS
While pulling together data for this post, I noticed that EBS read latencies (remember, that's Amazon's network block device) jumped way up about a week ago:
I'm not going to dig into this one right now. It is a bit of a cautionary tale, however. Suppose you'd built a latency-sensitive system on EBS. You even did your homework and spent a week benchmarking it. If that week began on March 12th, you'd have determined that 99th percentile read latency was around 125 ms. You might be pretty unhappy when it jumped to the current 300 ms. Perhaps you could complain to Amazon, but as far as I can tell they provide no latency SLA of any sort; they don't even say anything about what sort of latency you should expect. (I don't mean to single out EBS or Amazon. I haven't encountered much latency guidance, let alone an SLA, for any of the storage services I've been benchmarking.)
I've seen multiple people say that they think Amazon de-prioritizes ICMP packets. Have you tried a latency check with TCP?
ReplyDeleteThat's interesting. I haven't tried an equivalent measure using TCP, but will look into it.
ReplyDeleteVery interesting results. I am doing a similar set of experiments on EC2, but got some different numbers. In particular, I find that the mean ping RTT between intra-zone instances depends on your ping frequency and the CPU usage of your hosts. So I wonder to generate your numbers and graphs, did you simply ping every second without any other CPU intensive tasks running in your boxes, or you have some specific configuration for your experiments?
ReplyDeleteThanks a lot.
These statistics come from m1.small instances which are lightly loaded. Each benchmark (including pings) is executed once every 10 seconds, and there is nothing else happening on those instances.
ReplyDeleteThere are many reasons our numbers might diverge. At the top of the list is that the numbers I report here generally come from a single EC2 instance. Network and disk performance vary widely across instances. In a few weeks I'll have a new post going into depth on this topic (variance) for disk performance, including EBS performance which is heavily network-dependent. Later on I hope to do a similar variance analysis for network performance. Subscribe to blog.scalyr.com/rss if you want to see this when it's posted.
Great! Thanks for your reply. We are also doing some in depth analysis of network performance variance in EC2. Looking forward to your upcoming blog posts.
DeleteAny more recent updates? Not sure if AWS has made any improvements there in 6 years.
ReplyDeleteI'd love to revisit these experiments, but haven't found the time.
ReplyDelete