Friday, June 11, 2010

A quick survey of client latencies

In an earlier post, I examined network latencies as measured by Google Chrome.  As a follow-up, I've repeated the experiment using a variety of browsers, hardware devices, and network links.  Here is a quick overview of the results:

Operation
# samples
10th %ile
Median
Mean
90th %ile
99th %ile
99.9th %ile
Chrome Websocket / DSL
897
89.6 ms
94.0 ms
105.0 ms
105.0 ms
273.0 ms
881.0 ms
Chrome / DSL
897
102.0 ms
111.0 ms
121.0 ms
118.0 ms
337.0 ms
1.07 sec
Firefox / DSL
1793
98.9 ms
105.0 ms
116.0 ms
116.0 ms
273.0 ms
1.07 sec
Safari / DSL
1755
98.5 ms
103.0 ms
111.0 ms
107.0 ms
270.0 ms
1.19 sec
iPhone / DSL
1182
145.0 ms
156.0 ms
232.0 ms
294.0 ms
1.03 sec
3.94 sec
Nexus One / DSL
1158
132.0 ms
147.0 ms
589.0 ms
233.0 ms
1.91 sec
68.4 sec
iPhone / AT&T 2G
1063
487.0 ms
629.0 ms
875.0 ms
1.22 sec
5.53 sec
15.9 sec
Nexus One / T-Mobile 3G
949
286.0 ms
320.0 ms
345.0 ms
381.0 ms
915.0 ms
2.27 sec
Nexus One / AT&T 2G
240
351.0 ms
438.0 ms
601.0 ms
668.0 ms
5.49 sec
6.31 sec
Nexus One / T-Mobile 2G510 378.0 ms 409.0 ms 429.0 ms 479.0 ms 790.0 ms 2.61 sec

[Fine print: All of these measurements involve a client in the S.F. Bay Area area talking to an Amazon EC2 server in Virginia.  In light of the previous post, both the client and server were minimally loaded.  The first result uses Web Sockets, the others all use XMLHttpRequest (only one of my test browsers support Web Sockets).  The client device, if not mentioned, is a MacBook Pro; the browser, if not mentioned, is the device's built-in browser.  The iPhone is a first-generation model (shocking, I know).  All cellular network tests involved a full strength signal (according to the phone's status display), except for "iPhone / AT&T 2G" which had 3 or 4 out of 5 bars.  The DSL samples were all taken at roughly the same period of time, from the same location, and thus experienced the same DSL conditions.  Your mileage may vary.  Past performance is no guarantee of future results.]
This is a very un-scientific study: the sample counts are small, and each test was made from a single location over a brief period.  Still, some trends are clear:
  • As in my previous experiments, median latencies from the MacBook are quite good, and the tail is not terrible either.
  • There are no glaring differences between browsers.
  • Web sockets, currently supported only by Chrome (among the browsers I tested), continue to look like a good idea.
  • Even over the DSL line (via WiFi), both cell phones were substantially slower than the MacBook, with a very long tail.
  • All of the cellular connections were much slower than DSL.  3G is much faster than 2G, and not all 2G connections are created equal.
No surprises here.  I wasn't sure what to expect from the cellular connections.  It's perhaps surprising that they're so much slower than DSL in this test.  The amount of data exchanged is small -- around 600 bytes, most of which is request headers.  I don't know the nominal bandwidth of these 2G connections, but let's suppose it's 128Kbps.  600 bytes is 4800 bits, which would take roughly 37 milliseconds to transmit at 128Kbps.  Yet even the 10th percentile figures are at least 200 milliseconds slower than the same device communicating via WiFi + DSL.

Impact of request size

I decided to directly test the impact of request size on latency.  According to Firebug, when I run this benchmark in Firefox, the request headers are as follows:

Host: metrics2.amistrongeryet.com
User-Agent: Mozilla/5.0 (Macintosh; U; Intel Mac OS X 10.6; en-US; rv:1.9.2.3) Gecko/20100401 Firefox/3.6.3
Accept: text/html,application/xhtml+xml,application/xml;q=0.9,*/*;q=0.8
Accept-Language: en-us,en;q=0.5
Accept-Encoding: gzip,deflate
Accept-Charset: ISO-8859-1,utf-8;q=0.7,*;q=0.7
Keep-Alive: 115
Connection: keep-alive
Referer: http://metrics2.amistrongeryet.com/CloudMetricsEC2/netbench.jsp
Cookie: sid=s1; browserId=dummy; sid=s1

for a total of 475 bytes.  (The other components of the request and response are small by comparison, so I don't bother to detail them here.)  I was able to easily surpress the User-Agent, Accept, and Accept-Language headers using XMLHttpRequest.setRequestHeader (e.g. request.setRequestHeader("User-Agent", "")), reducing the request headers to 263 bytes.  Repeating the Firefox / DSL test, this yielded a small but definite improvement:

Operation
# samples
10th %ile
Median
Mean
90th %ile
99th %ile
99.9th %ile
Regular headers 642 100.0 ms 110.0 ms 116.0 ms 117.0 ms 458.0 ms 510.0 ms
Reduced headers 641 98.8 ms 104.0 ms 113.0 ms 116.0 ms 399.0 ms 488.0 ms

With additional effort, it should be possible to further shrink both the request and response, but on DSL the savings don't appear to be large.  The setRequestHeader trick doesn't seem to work on the Nexus browser, so I wasn't able to directly reproduce this comparison on a cellular link.  Instead, I did a side-by-side test of the regular request headers vs. "padded" headers (adding an extra header containing 500 bytes of text).  Here are those results:

Operation
# samples
10th %ile
Median
Mean
90th %ile
99th %ile
99.9th %ile
T-Mobile 3G 310 257.0 ms 282.0 ms 299.0 ms 357.0 ms 527.0 ms 579.0 ms
T-Mobile 3G (padded) 309 285.0 ms 318.0 ms 338.0 ms 400.0 ms 653.0 ms 1.5 sec
T-Mobile 2G 426 380.0 ms 426.0 ms 454.0 ms 549.0 ms 1.01 sec 1.25 sec
T-Mobile 2G (padded ) 426 421.0 ms 471.0 ms 499.0 ms 621.0 ms 948.0 ms 1.12 sec

All tests were on a Nexus One with a full-strength signal.  Once again, request size has only a moderate impact.

Impact of WiFi

Another variable to be isolated is a wired connection vs. WiFi.  Here are figures for Chrome running on two different Macs, both connected to the same DSL line, one via WiFi and one via Ethernet:

Operation
# samples
10th %ile
Median
Mean
90th %ile
99th %ile
99.9th %ile
XMLHttpRequest / Ethernet 2227 108.0 ms 113.0 ms 119.0 ms 120.0 ms 326.0 ms 706.0 ms
XMLHttpRequest / Wifi 2069 108.0 ms 113.0 ms 124.0 ms 124.0 ms 397.0 ms 516.0 ms
Websocket / Ethernet 2226 90.4 ms 97.9 ms 102.0 ms 106.0 ms 198.0 ms 894.0 ms
Websocket / Wifi 2069 92.7 ms 101.0 ms 110.0 ms 107.0 ms 385.0 ms 540.0 ms

There's a difference, but it's fairly minor, at least through the 90th percentile (and this sample is too small to place much weight in the 99th percentile figures).  Clearly, WiFi does not explain the speed difference between a smartphone and a conventional computer when both are connecting to a DSL line.

The conclusion seems to be that phones are just plain fundamentally slower.  This could be a property of raw processing speed, the browser implementation, competition from background tasks, or all of the above; but it does not seem to relate to factors I can control in an experiment.  Encouragingly, the newer phone (Nexus One) and newer network (3G) both perform better than the original iPhone and 2G, so perhaps we can look forward to a general trend of improvement.

Appendix: Histograms

There are no surprises in any of the histograms for these benchmarks, but as histograms seem to be a theme for this blog, I'll toss in a few.  Here's the "Chrome / DSL" XMLHttpRequest benchmark:


Many of the histograms look like that -- a sharp spike around 100ms, and a tail out to 1 second or so, with not much structure in the tail.  (More structure might be visible with a larger sample count.)  The iPhone and Nexus DSL tests had a broader peak -- here's the iPhone:


The block of timings in the 200-300ms range don't seem to be explained by WiFi or other network issues, so perhaps they reflect garbage collection, CPU contention, or some other environmental factor on the phone.

The cellular links had much broader peaks; here's the iPhone again (this is the same AT&T 2G test reported above):


Other cellular links have histograms similar to this one, though not as wide.

Friday, May 28, 2010

More on the RDS latency oscillation

[Sorry for the long gap in posts; I've been working on other things.  Posts are likely to be somewhat sporadic for the foreseeable future, especially as I have quite a bit of travel coming up this summer.]

In Three Latency Anomalies, I mentioned a periodic oscillation in latency for simple read and write operations in Amazon's RDS (hosted MySQL) service.  I opened a support ticket with Amazon, and eventually received this response:

Hi Steve,

The latency you're seeing may be related to the DB Instance class (db.m1.small) that you're running. The I/O performance on the db.m1.small is Moderate, vs. High for the Large and Extra Large DB Instance classes. We are working on publishing guidelines around this variance on the Amazon RDS product page.

You might try running your test on one of the "High" I/O performing systems and see if that improves the latency issues that you're experiencing.

Regards,
The Amazon RDS Team

The I/O explanation didn't sound right to me, because the variance appears even when repeatedly re-reading a single record, which ought to be cached.  But I decided to try their advice and experiment with a "large" RDS instance.  While I was at it, I added a couple more small instances and an additional client.  This gave me 8 client/server pairs to test -- 2 clients, each issuing requests to 4 servers.  The operations benchmarked are:
  • Fetch one small record (always the same record)
  • Fetch a small record randomly selected from a table of 1,000,000 records
  • Update one small record (always the same record)
  • Update a small record randomly selected from a table of 1,000,000 records
All operations use the same table, which is shared across clients (but, obviously, not across servers).  Here is the last 20 hours worth of latency data for the first operation, on the original client / server pair:

Here is the same graph, for the same client but a second"small" RDS instance:

Not only does it show the same oscillation, the oscillations are aligned.  Uh oh: could this be a client issue after all?  Well, that's why I launched a second client (on a different EC2 instance).  Here are the results for the second client, talking to the first server:

Very similar to the graph from the first client.  Here's the second client talking to the second server:

So, two different clients talking to two different servers, all presumably on different machines, showing latency oscillations that not only have the same frequency, but are precisely aligned.  I won't bother including graphs here for the third small server, but they look very similar to the above.

In theory, the only common element in these tests should be the network; and even there, I'd expect independent network paths to be involved.  In any case, my us-east-1b network measurements show no such oscillation.  So this additional data merely confirms the mystery.

I haven't shown data yet for the "large" server.  Here is the graph for client 2 fetching a single record:

This has the same periodicity as the other graphs, but the absolute latency values are much lower: 99th percentile latency oscillates between 5 and 20 ms, as opposed to something like 25 - 250 for the small servers.  Finally, just to make things really fun, client 1 talking to the large server does not show periodicity:

The periodicity is present in the 90th percentile plot, but it's not apparent in the 99th percentile.  I happen to have several days' worth of data for this pair, which confirms that only the 90th percentile plot has much periodicity:

One explanation would be that, for this particular server pair, there is an additional component to the latency tail that prevents 99th percentile latency from dropping below 20ms.  That could be explained by any client or network issue that imposed a 20ms delay for 1 to 10 percent of operations.

Conclusion: I still have no idea what causes the periodicity, but I'm even more convinced that something interesting is involved.  I'll pass the new data back to the RDS team and see what they can make of it.

Thursday, May 6, 2010

Browser network latencies

As an experiment, I spent part of last week writing a simple HTML5-based multiplayer video game (a clone of the original Maze War).  It works surprisingly well; browsers have come a long way.

A critical parameter for this sort of game is communication latency.  When I shoot at you, how soon does the incoming missile appear on your screen?  If the latency is not very short, the game feels "laggy".  In my playtesting, lag wasn't a major problem, but occasionally it seemed like things would hiccup a bit.  I decided to do some more scientific testing.  I wrote a simple web page that issues an XMLHttpRequest once per second, and then reports the latency back to my microbenchmark server.  Here is the resulting histogram:


Operation# samplesMin10th %ileMedianMean90th %ile99th %ile99.9th %ileMax
XMLHttpRequest (OS X Chrome N. Calif. -> EC2 US East)13929104.0 ms98.9 ms105.0 ms123.0 ms132.0 ms417.0 ms713.0 ms8.64 sec

(This reports latency for an XMLHttpRequest from Google Chrome 5.0.375.29 beta, on a MacBook Pro running OS X 10.6.3, over not-very-good 1500Kbps/500Kbps DSL in the S.F. Bay Area, to an Amazon EC2 server in Virginia.  All benchmarks discussed in this post use the same setup, except as noted.  All benchmarks also ran for the same time period, and so experienced the same network conditions, again except as noted.)

These figures aren't too shabby; 100ms or so strikes me as a reasonable response time.  However, we have a fairly long tail, so players will see occasional lag.  Here is the same data, graphed over time:

There was a spike around 9 PM, but if I exclude that time period, the histogram doesn't change much.  The jittery latency seems to be present consistently over time.

Surprise!  It's not the network

An obvious explanation for this latency tail is delays in the network.  To verify that, I measured ping times between the same pair of machines.  Surprisingly, the ping data shows a much shorter tail:


Operation# samplesMin10th %ileMedianMean90th %ile99th %ile99.9th %ileMax
Ping (N. Calif. -> EC2 US East)4171791.9 ms89.6 ms93.5 ms97.2 ms101.0 ms140.0 ms414.0 ms907.0 ms

And most of the tail turns out to be localized to the 9 PM event:


Excluding that time period, most of the tail vanishes from the ping histogram: 99.9th percentile ping latency is only 154ms!  Maybe my DSL isn't quite as bad as I'd thought.

It's partly the server

The tail in the XMLHttpRequest data must originate elsewhere.  Perhaps on the server?  My EC2 server is juggling quite a few tasks by now: it's running dozens of benchmarks, pulling additional benchmark data from App Engine, accumulating histograms, and serving the XMLHttpRequests for this latest benchmark.  Overall CPU utilization is still fairly low, and CPU-sensitive benchmarks running on the server aren't showing much of a tail, but still perhaps there is some effect.  So I fired up a second server, configured identically to the first but with no workload, and ran the same test there.  The results are faster than for the original server, but only slightly:

Operation# samplesMin10th %ileMedianMean90th %ile99th %ile99.9th %ileMax
XMLHttpRequest (OS X Chrome N. Calif. -> EC2 US East)13929104.0 ms98.9 ms105.0 ms123.0 ms132.0 ms417.0 ms713.0 ms8.64 sec
XMLHttpRequest (OS X Chrome N. Calif. -> EC2 US East) B10446104.0 ms99.4 ms108.0 ms114.0 ms117.0 ms323.0 ms629.0 ms791.0 ms
(I've repeated the original data for comparison.  The lightly-loaded "B" server is shown in the last row.)

It's partly HTTP

So, server CPU contention (or Java GC) may be playing a minor role, but to fully explain the latency tail we have to keep digging.  Perhaps Web Sockets, by eliminating most of the overhead of the HTTP protocol, would help?  Happily, Chrome now has Web Socket support.  I decided to try several connection methods: XMLHttpRequest, Web Sockets, and JSONP (a trick wherein you issue a request by dynamically creating a <script src=...> tag, and the server returns a JavaScript file whose execution delivers the response).  JSONP has the useful property of not being bound by the "same origin" security policy, enabling one additional connection method: "best of two".  In this method, I have the browser issue a Web Socket request to one server, and a simultaneous JSONP request to the other.  The latency is measured as elapsed time from when we begin sending the first of these two requests, until either response is received.  Here are the results:

Operation# samples10th %ileMedianMean90th %ile99th %ile99.9th %ile
JSONP (OS X Chrome N. Calif. -> EC2 US East)1392998.7 ms104.0 ms123.0 ms155.0 ms416.0 ms688.0 ms
XMLHttpRequest (OS X Chrome N. Calif. -> EC2 US East)1392998.9 ms105.0 ms123.0 ms132.0 ms417.0 ms713.0 ms
Websocket (OS X Chrome N. Calif. -> EC2 US East)1393089.6 ms93.8 ms108.0 ms122.0 ms375.0 ms582.0 ms
JSONP (OS X Chrome N. Calif. -> EC2 US East) B1044798.6 ms104.0 ms116.0 ms132.0 ms341.0 ms652.0 ms
XMLHttpRequest (OS X Chrome N. Calif. -> EC2 US East) B1044699.4 ms108.0 ms114.0 ms117.0 ms323.0 ms629.0 ms
Websocket (OS X Chrome N. Calif. -> EC2 US East) B1044789.5 ms93.1 ms96.3 ms96.8 ms119.0 ms556.0 ms
Websocket best-of-2 (OS X Chrome N. Calif. -> EC2 US East) B1044689.6 ms93.6 ms98.4 ms101.0 ms219.0 ms551.0 ms
Ping (N. Calif. -> EC2 US East)4171789.6 ms93.5 ms97.2 ms101.0 ms140.0 ms414.0 ms
Ping (N. Calif. -> EC2 US East) B3914689.5 ms93.1 ms94.8 ms96.9 ms107.0 ms424.0 ms

For each server, Web Sockets are clearly the fastest of the three connection techniques.  On the lightly loaded "B" server, the Web Socket latencies are almost as good as the ping latencies.  However, if I exclude the 9PM spike, there is still a noticeable difference in the tails: 99th and 99.9th percentile latencies for Web Socket requests are then 127 and 396 milliseconds respectively, while the equivalent ping latencies are 104 and 113 milliseconds.

It's interesting that the best-of-2 technique does not perform well.  To the extent that the latency tail is caused by server CPU contention, best-of-2 should be a big improvement.  It's unclear how much it would help with network issues, and it definitely can't help with client issues.  The poor performance suggests that client issues contribute significantly to the latency tail.

And it's partly client load

Now, we've more or less controlled for network latency and server CPU.  What factor could explain the remaining difference between ping and Web Socket latencies?  Perhaps it's something in the browser.  During the preceding tests, I had at least a dozen Chrome tabs open, some to complex sites such as Gmail.  I restarted Chrome with only one tab, open to the page that executes the benchmark:

Operation# samples10th %ileMedianMean90th %ile99th %ile99.9th %ile
JSONP (OS X Chrome N. Calif. -> EC2 US East) B103898.6 ms103.0 ms115.0 ms134.0 ms248.0 ms492.0 ms
XMLHttpRequest (OS X Chrome N. Calif. -> EC2 US East) B1038106.0 ms112.0 ms112.0 ms117.0 ms211.0 ms446.0 ms
Websocket (OS X Chrome N. Calif. -> EC2 US East) B103789.5 ms93.0 ms94.8 ms96.6 ms100.0 ms118.0 ms
Websocket best-of-2 (OS X Chrome N. Calif. -> EC2 US East) B103789.5 ms93.1 ms95.9 ms96.9 ms107.0 ms369.0 ms

These results are from a short run (only about an hour), at a different time period than the others, and so should be taken with a grain of salt.  However, the Websocket figures look really good, comparable to raw ping times.  The HTTP-based connection techniques still show a significant tail.  (It's worth noting that this might not be entirely due to HTTP overhead; it could also reflect overhead in the browser implementation of the respective connection techniques.  JSONP in particular is a rather baroque approach and requires DOM manipulation and dynamic compilation.)

A convenient outage -- score one for best-of-two

During an earlier benchmark run (not reported here), my "B" server went offline.  Amazon's explanation:

5:39 PM PDT We are investigating instance connectivity in the US-EAST-1 region.
5:55 PM PDT A subset of instances in a single Availability Zone became unavailable due to a localized power distribution failure. We are in the process of restoring power now.

No doubt this was inconvenient for some people, but for me it provided a handy test of the best-of-2 connection method.  Indeed, all of the other "B" server benchmarks began failing, but the best-of-2 results were unperturbed.

This event also provided an interesting peek into Amazon's handling of outages.  The event began at around 5:15, at least for my machine.  Amazon's service dashboard was first updated at 5:39, roughly 24 minutes later.  Hence, when I first detected the problem, I had no information as to whether it was something I'd done, an Amazon problem specific to my machine, or a more widespread Amazon problem.  It would be nice if the AWS dashboard included up-to-the-minute service health metrics based on automated monitoring.  It would also be nice if health information was propagated to the status page for individual EC2 instances.  All the while that the machine was offline, the dashboard page for that instance continued to indicate that the instance was up and running.

One other quibble: the status reports never actually indicate which Availability Zone was impacted (it was us-east-1b).  Seems silly not to provide that information.

Stress test

Just for kicks, I decided to repeat the tests while saturating my DSL line (by uploading a bunch of photos to Picasa).  The results are not pretty:

Operation# samples10th %ileMedianMean90th %ile99th %ile99.9th %ile
JSONP (OS X Chrome N. Calif. -> EC2 US East) B613101.0 ms419.0 ms559.0 ms1.35 sec1.75 sec2.35 sec
XMLHttpRequest (OS X Chrome N. Calif. -> EC2 US East) B612110.0 ms388.0 ms543.0 ms1.35 sec1.69 sec5.03 sec
Websocket (OS X Chrome N. Calif. -> EC2 US East) B61291.1 ms398.0 ms524.0 ms1.31 sec1.69 sec2.35 sec
Websocket best-of-2 (OS X Chrome N. Calif. -> EC2 US East) B61291.2 ms372.0 ms524.0 ms1.46 sec1.69 sec2.14 sec

Here, all of the connection methods were equally bad.  (It would have been interesting to run ping tests at the same time, to see whether TCP congestion control was part of the problem, but I neglected do so.)

Conclusion: good luck, you'll need it

With Web Sockets, a lightly loaded client, a lightly loaded server, a lightly loaded DSL line, and favorable winds, it's possible to get uniformly fast communication between a browser and server.  Disturb any of those conditions, and a latency tail rears up.  Where does that leave us?

In principle, you can control server load.  Of the major browsers, so far only Chrome implements Web Sockets as far as I know.  (Flash provides similar functionality, which I may benchmark for a later post.)  Client load and DSL load are entirely out of our control; the best one might manage is to give feedback to the user.  And, while Google is rumored to have some influence over the weather, when it comes to favorable winds the rest of us just have to hope for the best.

Wednesday, April 28, 2010

Three Latency Anomalies

Last week, I discussed various choices for cloud data storage.  Subsequently, I've been digging into latency anomalies in some of those systems.  In this post, I'll talk about what I've found.

App Engine Memcache
I'm running a number of benchmarks for App Engine's Memcache service, but they all give similar results, so I'll focus on the simplest: reading a single value, with a random key.  Here's a graph (from http://amistrongeryet.com/op_detail.jsp?op=gae_db_read_1):


Aside from the jump on April 23d, these latencies are pretty stable, probably the most stable of any network-based service I'm measuring.  There's not much variation over time, and the gap between the 10th and 99th percentile is fairly small.  In absolute terms, it's the fastest of the storage services I discussed last week, and much faster than the other network-based services.

So what's the anomaly?  Well, this service is fast, but not as fast as it should be.  Remember, the "mem" in Memcache refers to RAM.  A Memcache read amounts to a hashtable lookup.  Server-side execution time should be trivial, and client-perceived latency (as I'm measuring) should be dominated by network latency.  13 ms median is a long time for an intra-cluster round trip.  Equally suspicious, across 125,000 samples to date, the minimum time recorded was 5 ms.  It's hard to explain that with network latency unless the App Engine servers are hundreds of miles away from the memcache servers -- which makes no sense.  (By way of comparison, I've been measuring ping times within and between Amazon EC2 availability zones, and the median latencies are 450 microseconds and 2 ms, respectively.  I don't have a way of directly measuring App Engine's internal network, but there's no reason to believe it would be vastly slower.)

In the end, someone at Google was kind enough to explain this for me.  It turns out to be a known issue with the RPC implementation in the Java version of App Engine, with the effect of imposing a floor on RPC latency.  Operations which take longer than this floor -- say, Datastore access -- are not affected, but fast operations like Memcache are.  It will be fixed in a future App Engine update.

As a cross-check, it was suggested that I re-implement the benchmark in Python.  The results are indeed much faster, with median latency of 4.15 ms (compared to 22ms from Java, after last week's jump).

One lesson here is that it's important to have an intuition of what's reasonable.  Memcache was one of the fastest services I measured, but it was still slower than it should have been.  If you don't have a sense of how your system ought to behave, you'll miss problems.

Another lesson is that no story ever ends; there are always loose ends you don't have time to tie up.  In this case, there's that mysterious jump on April 23d.  There's also a fairly long tail even in the Python latencies, which could have any number of causes, from network congestion to garbage collection to CPU contention.  I'm not going to bother looking into any of that, but if I was building a system that depended on ultrafast memcache latencies, I'd probably have to.

EC2 networking

On April 24th, I added a handful of network benchmarks.  Each benchmark measures ping times, from the data gathering server (an EC2 "small" instance in availability zone us-east-1b) to a particular destination:
I'm only measuring one instance of each category (e.g. one pair of servers in us-east-1b), so take the results with a grain of salt.  But, hopefully, sampling over a long period of time compensates somewhat.  Eventually I may get fancier, launching a collection of servers for an hour now and then and measuring ping times across many server pairs.

Network latencies are important.  Any complex system depends on communication among its components.  If you want to run a reliably fast service, it helps a lot to have reliably fast networking.  At a minimum, you need a deep understanding of your network latency; otherwise, you can't hope to understand how your service will behave.

After running the benchmark for a few hours, the latency histogram for intra-zone pings looked like this:


I was dismayed to see that 99th percentile latency was 48 ms.  That would make it very difficult to meet the 50 ms goal I set for storage read latencies in my previous post -- just getting to the storage server would use up the entire latency budget.  As with memcache, this result struck me as fishy, so I decided to dig further.  It struck me that Amazon might use a short DNS TTL for the internal server names in their data centers, and that DNS latency might be part of the problem.  So I added two variants of the intra-AWS ping benchmarks.  One variant uses a numeric IP address instead of a DNS name, and the other variant issues two pings in a row and measures latency of the second.  (All of this is done using the "ping" command-line tool.  I'm exec'ing it from my Java process, and parsing the ping time from the command-line output.)

Both variants were, indeed, much faster.  (More precisely, they had shorter tails.  All variants are fast at median.)  But the really interesting thing is that, when I launched the new variants, the original benchmark sped up as well!  Here's a graph over time of the original intra-zone ping benchmark:

What happened?  I don't know, but I have a strong hypothesis.  The benchmark server wakes up once every 10 seconds, and runs all of its ever-growing collection of benchmarks in a burst.  The order in which the benchmarks execute is randomized every time.  So, half of the time, when the original intra-zone single-ping benchmark executes, it's happening shortly after the intra-zone ping-twice-and-measure-the-latter benchmark.  Thus, the DNS cache is more likely to be warm.  ARP lookup, or other arcana above my pay grade, might be involved as well.

Considering only the time period in which all three benchmarks were running, they still have distinct latency histograms:

Original benchmark (single ping, using DNS name):


Same benchmark, but using a numeric IP address instead of dns name:


Back to using a DNS name, but now telling the ping command to issue two pings, and recording the latency of the second one:


Median latency for each variant is around 0.45 milliseconds.  The means are 3, 2.45, and 2.13 respectively.  Eyeballing the histograms, you can see that the pronounced spikes at 10 and 20 ms are smaller in each subsequent benchmark.  The large peak around 0.45 milliseconds seems to be shifted somewhat to the left in the third benchmark; I wonder if that is sampling bias: during momentary network congestion, the first ping might not complete until the congestion clears, giving the second ping a better chance at a smooth run.

These figures also gave me a nice example of the danger of reading too much into percentiles.  90th percentile latency for these three benchmarks is 12 ms, 9 ms, and 0.77 ms respectively.  Huh?  Obviously the third benchmark is not ten times faster than the others.  This is an artifact of the trimodal distribution.  In the first two benchmarks, a bit more than 10% of requests fall in the 10ms and 20ms spikes.  In the third benchmark, a bit less than 10% of those requests fall in the spikes, so the 90th percentile latency jumps down into the primary peak.

I'll explore network latency further in subsequent posts, where I'll try to identify (or, if necessary, invent) a reliably-fast Java RPC mechanism.  For now, a few things are worth noting:
  • Median intra-cluster network latency is very fast, relative to the systems I've been benchmarking.
  • Network latency histograms are complicated.  (This should not surprise anyone.)  You can't characterize network performance with a single number like "mean ping time" or "rate of packet loss".
  • If you care about the latency tail, you have to worry about things like DNS lookup, even within your data center.
  • (Hypothesis) it helps to keep your connections hot, i.e. to exchange messages frequently.  "Warm" -- say, communicating every 10 seconds -- isn't good enough.  This has implications for large clusters: if a server communicates with many other servers, it's hard to keep all of those pairs hot.  (Unclear whether this is an issue if you avoid DNS and use numeric IPs.)
While I'm on the topic, I'll provide histograms for cross-zone latency, and latency from EC2 to google.com.  First, AWS us-east-1b to us-east-1a (numeric IP):


Second, us-east-1b to google.com (DNS):


Median latencies are 2.05 and 4.56 ms, respectively.  Means are 5.62 and 11; 99th percentiles are 30.9 and 51.6.

I'm not sure what I should have expected, but these seem nicely fast to me.  Google must have presence quite close to Amazon's us-east-1b facility.  (The Yahoo ping times were much slower, but given that I'm only measuring from a single location, it would be a mistake to read much into that.)

RDS

RDS, recall, is Amazon's hosted MySQL service.  The benchmark I'll discuss here is the read benchmark I used in the last post, i.e. fetching one small record chosen randomly from a table of one million records.  Full data for this benchmark is at http://amistrongeryet.com/op_detail.jsp?op=rds_read.

When I first launched this benchmark, the latency histogram looked great:


When I checked later, median latency had stayed put, but the tail had stretched way out.  Here's the cumulative histogram over the entire week-long history of this benchmark:

You can see that the two histograms are very different.  Both medians are around 1 ms, but the mean jumps from 1.74 to 16.3!  It turns out this operation exhibits periodic fluctuations in latency:

Remember that my load is absolutely uniform, a handful of simple operations repeated every 10 seconds.  What is up with that oscillation?

The short answer is, I do not yet know what is up with that oscillation.  I've been digging; started a thread on the AWS forum; and opened a case with AWS support; but no resolution yet.  Some things I've tentatively ruled out:
  • Client issues (e.g. CPU contention, Java GC delays, or other problems in the client).  The same client is running a wide variety of other benchmarks, and none of them show anything similar.
  • Network issues.  A fair number of those other benchmarks depend on the same us-east-1b network.  (It is conceivable that it is an issue specific to the network path between my client and the RDS instance.)
  • Disk latency.  I've implemented a few variants on the benchmark, one of which reads the same record over and over again; that record ought to get pinned in MySQL's cache.  The single-record benchmark exhibits the same periodic latency tail.
My best guess is some sort of CPU contention problem on the RDS server.  (People who work with me know I blame everything on CPU contention.)  However, I don't have much evidence.  Amazon's CloudWatch service shows that CPU utilization on the server is steady at about 12%, but it has one-minute resolution, so could be hiding some sort of bursty usage.  I'll keep digging.

A fourth anomaly: EBS

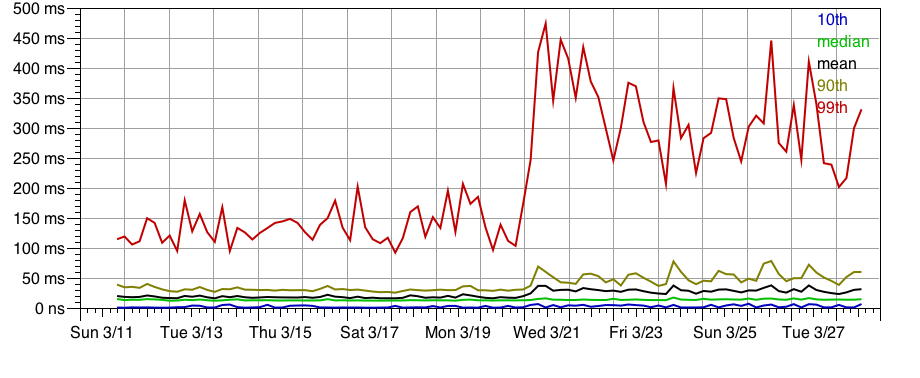
While pulling together data for this post, I noticed that EBS read latencies (remember, that's Amazon's network block device) jumped way up about a week ago:

As often seems to be the case, the median remained steady (around 13 ms), but mean, 90th percentile, and higher latencies all jumped by 1.5x to 2x, and have been elevated ever since.  There's also a nice diurnal cycle in the latency, which hadn't been visible before.  (In general, I haven't seen a lot of diurnal variation in these benchmarks; I'd expected more.)  The usual caveat: my benchmark is limited to a single EBS volume, so don't extrapolate to EBS as a whole.

I'm not going to dig into this one right now.  It is a bit of a cautionary tale, however.  Suppose you'd built a latency-sensitive system on EBS.  You even did your homework and spent a week benchmarking it.  If that week began on March 12th, you'd have determined that 99th percentile read latency was around 125 ms.  You might be pretty unhappy when it jumped to the current 300 ms.  Perhaps you could complain to Amazon, but as far as I can tell they provide no latency SLA of any sort; they don't even say anything about what sort of latency you should expect.  (I don't mean to single out EBS or Amazon.  I haven't encountered much latency guidance, let alone an SLA, for any of the storage services I've been benchmarking.)